Measuring What Matters: Replacing Vanity Metrics with Value Stream KPIs
Most organizations measure Agile adoption with metrics that feel good but reveal nothing about real business outcomes. Discover the flow metrics and value stream KPIs that actually predict organizational performance.
The Metrics Trap
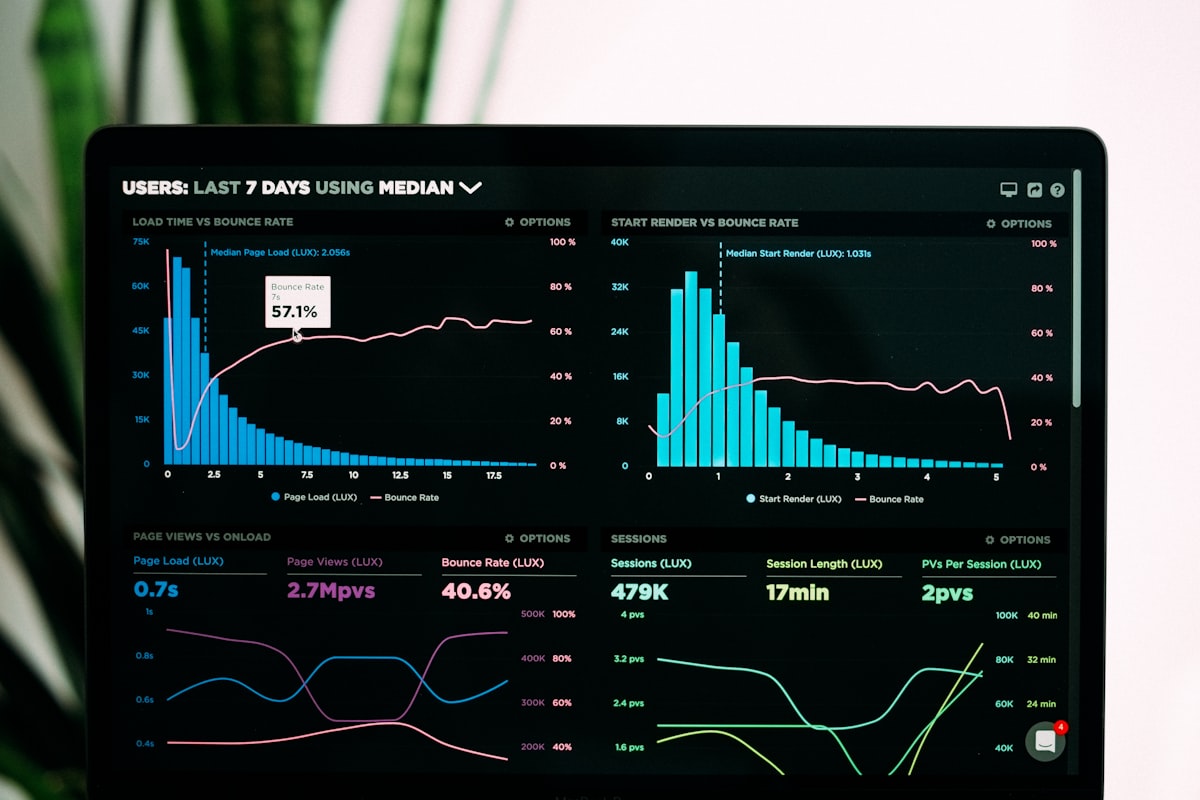
Every Agile transformation generates metrics. Velocity charts, sprint burndowns, cumulative flow diagrams, story point counts. These numbers feel rigorous. They're quantitative, trackable, and easy to present to leadership. They are also, in most cases, telling you almost nothing about whether the transformation is creating business value.
Velocity measures team output, not customer impact. Story points measure work committed, not problems solved. Burndown charts measure adherence to sprint plans, not market responsiveness. These are vanity metrics — numbers that look like evidence of progress without revealing whether the progress matters.
What Vanity Metrics Miss
The core failure of traditional Agile metrics is that they measure the machinery of delivery rather than the outcomes of delivery. They answer the question "are teams doing Agile?" rather than "is the organization becoming more effective?"
To answer the second question, you need a fundamentally different measurement framework — one grounded in the flow of value through the organization, not the activity of individual teams.
The Four Key Flow Metrics
Dr. Mik Kersten's work on the Project to Product transformation introduced a flow metrics framework that has become increasingly standard in mature Agile organizations. The four flow metrics are:
Flow Velocity
The number of business items (features, defects, risks, debt) completed per unit time. Unlike story point velocity, flow velocity is expressed in business terms that stakeholders can understand without translation. "We completed 12 customer-facing features this quarter" is a statement that means something to a CFO.
Flow Time
The elapsed time from when work is requested to when it is delivered. Flow time is one of the most powerful indicators of organizational agility. Long flow times signal queue buildup, coordination overhead, and batch thinking. Short, predictable flow times signal a well-functioning, low-overhead delivery system.
Flow Efficiency
The ratio of active work time to total flow time. If a feature takes 30 days to deliver but is only being actively worked on for 3 of those days, flow efficiency is 10%. This metric — typically between 5% and 40% in most organizations — reveals the waste embedded in handoffs, approvals, and waiting states that team-level Agile metrics are blind to.
Flow Load
The amount of work in progress across the value stream. Excessive flow load — too many items being worked on simultaneously — is a primary driver of long flow times and poor flow efficiency. Limiting work in progress is one of the highest-leverage interventions available to leadership.
The DORA Metrics
For technology delivery specifically, the DORA metrics (from the DevOps Research and Assessment program) provide a validated, research-backed measurement framework that predicts organizational performance:
**Deployment Frequency** — How often is code deployed to production? Elite performers deploy on-demand, multiple times per day.
**Lead Time for Changes** — How long does it take from commit to production? Elite performers achieve less than one hour.
**Change Failure Rate** — What percentage of deployments cause a production incident? Elite performers see less than 15%.
**Time to Restore Service** — How long to recover from a production failure? Elite performers restore in less than one hour.
These four metrics, tracked longitudinally, are statistically correlated with organizational performance, employee well-being, and commercial success. Organizations that improve their DORA metrics demonstrably become more competitive.
Outcome Metrics: The Ultimate Test
Flow and delivery metrics are leading indicators. The lagging indicators — the ones that ultimately justify the investment in Agile transformation — are business outcome metrics:
**Customer retention and Net Promoter Score** — Are customers staying? Are they recommending?
**Feature adoption rates** — Are the capabilities we're delivering being used by the customers we built them for?
**Revenue per released feature** — Are we building things that generate commercial value?
**Time-to-market for competitive response** — How quickly can we respond when a competitor moves or a market opportunity emerges?
These outcome metrics close the feedback loop from delivery to strategy. They tell you not just whether you're delivering fast, but whether you're delivering the right things.
Building a Measurement System That Drives Behavior
The goal of metrics is not to produce reports. It's to create feedback loops that inform decisions and drive learning. A well-designed measurement system:
**Is visible.** Metrics should be accessible to the teams that can influence them, not just to management.
**Is actionable.** Every metric should be paired with at least one lever — something teams or leaders can change in response to what the metric reveals.
**Is balanced.** A measurement system that optimizes only for speed will sacrifice quality. One that optimizes for quality will sacrifice responsiveness. Balance competing objectives explicitly.
**Evolves.** The metrics that matter at the beginning of a transformation are different from the ones that matter when the transformation matures. Review and refresh your measurement framework annually.
The shift from vanity metrics to meaningful measurement is itself a form of organizational learning — and it is among the most lasting contributions an Agile leader can make.

Ready to put this into practice?
Join a SAFe certification course and master agile at scale.
Browse Courses →

